Analyzing Adversary Infrastructure
Analyzing threat actor infrastructure to identify additional command & control servers.
The starting point
I recently completed the Intel-Ops Hunting Adversary Infrastructure course which taught me techniques and methods to identify and fingerprint malicious infrastructure. I wanted to use these techniques and methods to identify live threat actor infrastructure.
To find a starting point I read this article detailing a campaign of various malware being delivered with trojanized software. The article outlines the infection chain, the threat actor’s activities, defensive recommendations, and indicators of compromise (IOC).
During my initial review of the article one detail about the IOCs stood out to me. Two of the malware listed had their Command & Control servers (C2s) in the same network, this is not very common as threat actors often attempt to spread out their infrastructure among different service providers or only have a single C2 server per campaign.
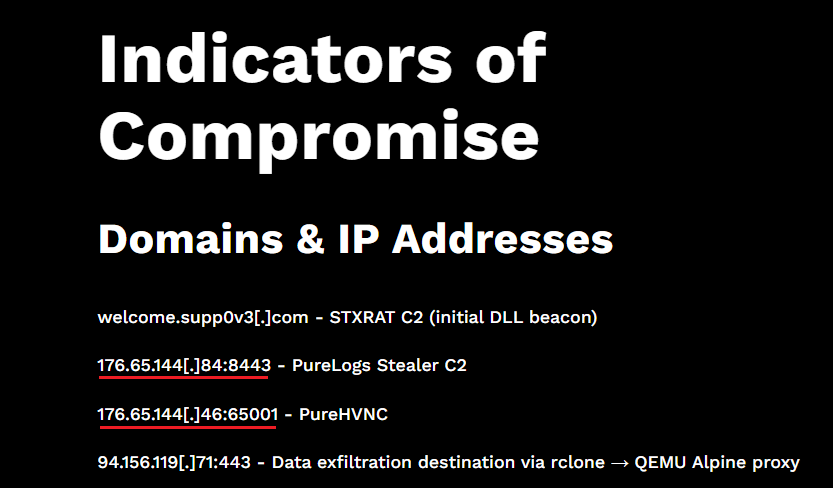
I chose these two IP addresses as the starting point for my investigation to identify additional infrastructure:
1
2
176.65.144[.]84
176.65.144[.]46
Finding the first pivot points
First it was necessary to find some information or component of the C2 servers that is visible to the outside world which could be used to pivot and find more servers. To do this I first queried Shodan and Modat to determine if either of these hosts was currently hosting any services, they were not. This was not a surprise as threat actors, or the hosting providers they use, often take down their infrastructure after it has been mentioned publicly.
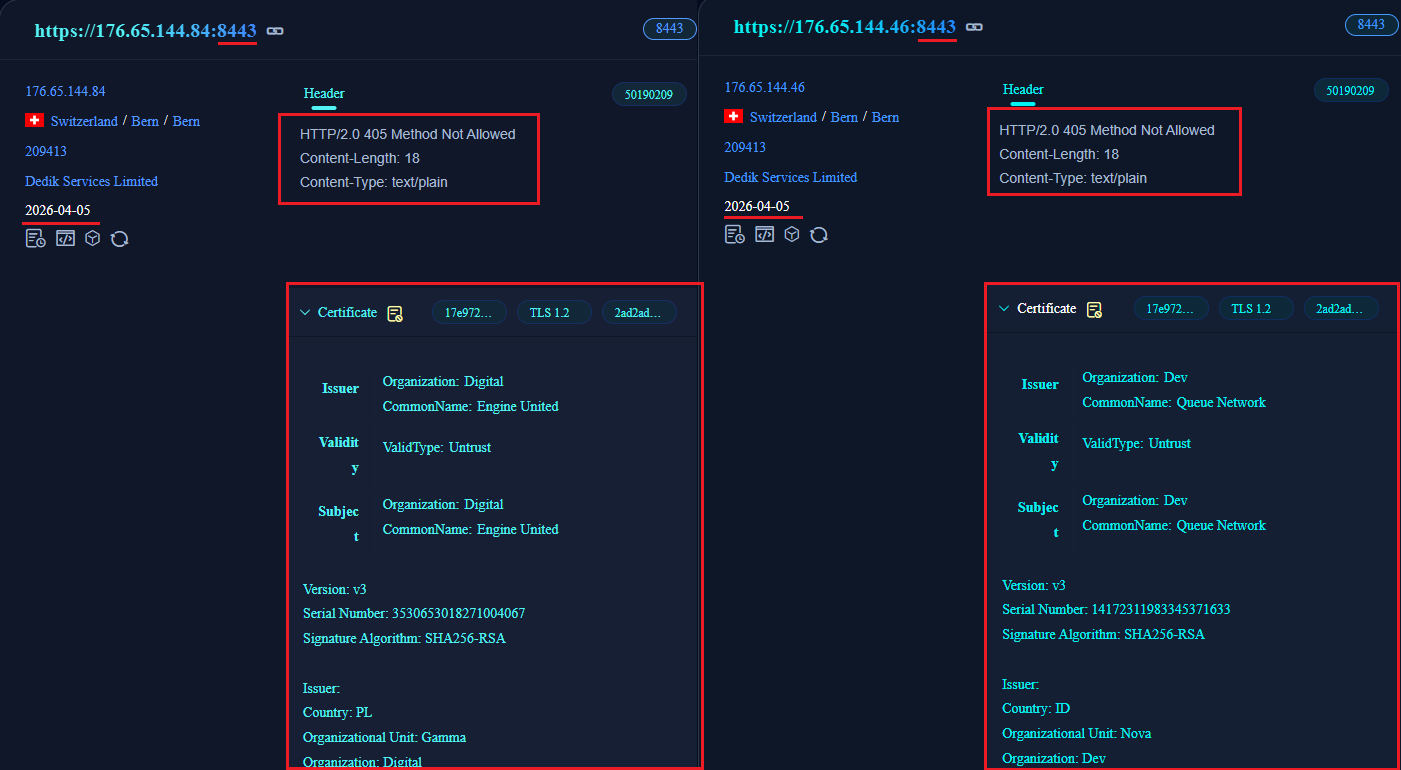
The next step was examining historical data for the hosts from Validin and FOFA. Interestingly the services showed that both IP addresses had hosted a service on port 8443 shortly before the article was published (April 13th). The article listed only one of them hosting a C2 at port 8443, with the other being present on port 65001. Another thing that was visible was that neither of the hosts had a service running on port 65001, however this could also be due to limitation of the platforms.
Quick look reveals both services at the port 8443 responded with identical headers and had the same JARM and HTML hashes, as well as a similar certificate with seemingly sensible but clearly fake details. These services appear to be the same one. The focus will now be on this service at port 8443, which according to the article was the C2 for PureLogs Stealer (credential harvesting tool).
Pivoting to identify live servers from Shodan
The two hosts no longer had the services visible so it was necessary to use historical data. As the hash for the HTTP headers and the HTML body are not calculated in the same way for FOFA and Shodan some other identifying data points had to be used. From the various attributes that FOFA records three specific identifiers were used to build a rough initial Shodan search query to find some live servers with the same C2. The JARM fingerprint value, which is a method for fingerprinting different TLS implementations, the port 8443 and the content length visible in the HTTP headers.
This resulted in the search query:
1
ssl.jarm:"2ad2ad16d00000022c2ad2ad2ad2ad46ff59a659b30fd8aeaa6755c67691b4" port:8443 "Content-Length: 18"
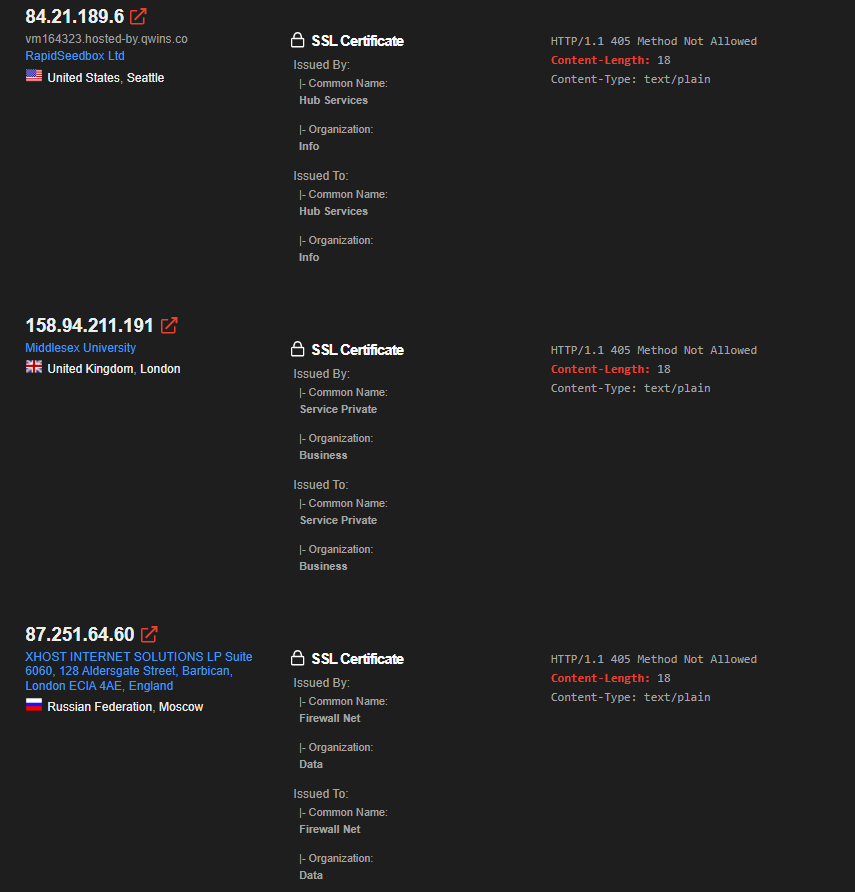
At the time of writing this query returns 19 hosts. It is possible to quickly identify the hosts have a similar service, almost certainly a C2 server, running with identical headers and similar nonsensical certificate details.
Tweaking the Shodan search query
After identifying live servers with the C2 services visible, it was necessary to further refine the Shodan search query. When doing infrastructure analysis it is risky to use more broad search terms, such as common port numbers or header content length values, as they can lead to falsely identifying servers as C2s. Though they can be very useful to identify initial pivot points. For example, currently Shodan reports ~6.5 million servers with port 8443 and ~29.9 million servers responding with the header length 18. Using these in the search query could easily leave in false positive findings if you are not careful.
The certificate details visible to Shodan for the hosts were all different, likely due to a randomized certificate generator. However, the HTTP header hash and HTML hash were found to be identical among the hosts with the known identifiers of the C2 server, so these values were used to improve the search query.
1
http.html_hash:1929577144 http.headers_hash:707481832
At the time of writing this query returns 26 hosts, suggesting the JARM fingerprint chosen initally was a limiting factor in the previous query.
Analyzing and grouping the results
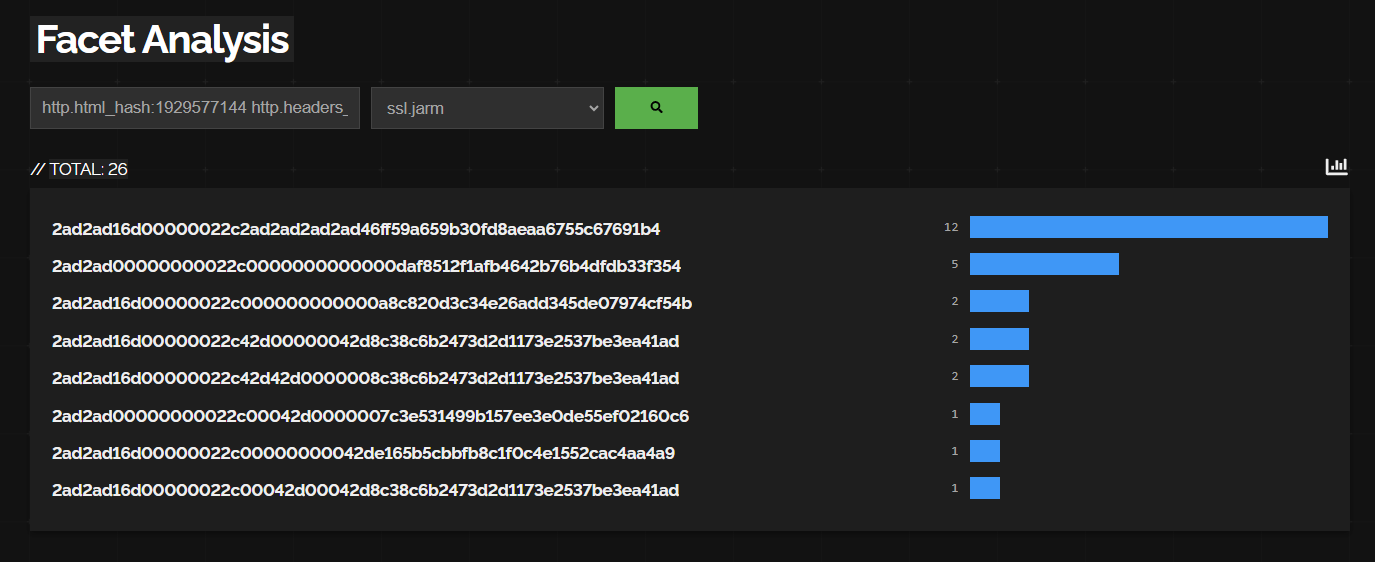
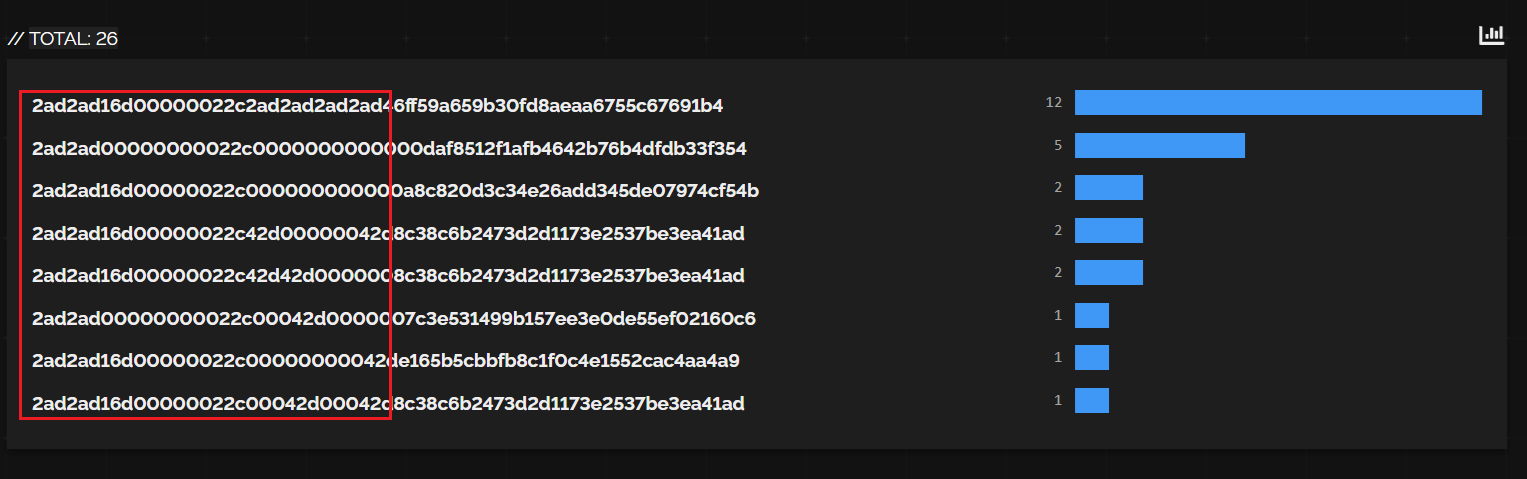
After going through the data of the remaining hosts, this can be clearly demonstrated as among the remaining hosts there was 8 different JARM values.
Another way to group the remaining hosts is by using the JA3S value, which is an alternative method to JARM for fingerprinting TLS implementations. When grouping by the JA3S value the hosts are split into groups of 12 and 14 hosts, this is due to the ciphers preferred by the hosts, as can be seen here.
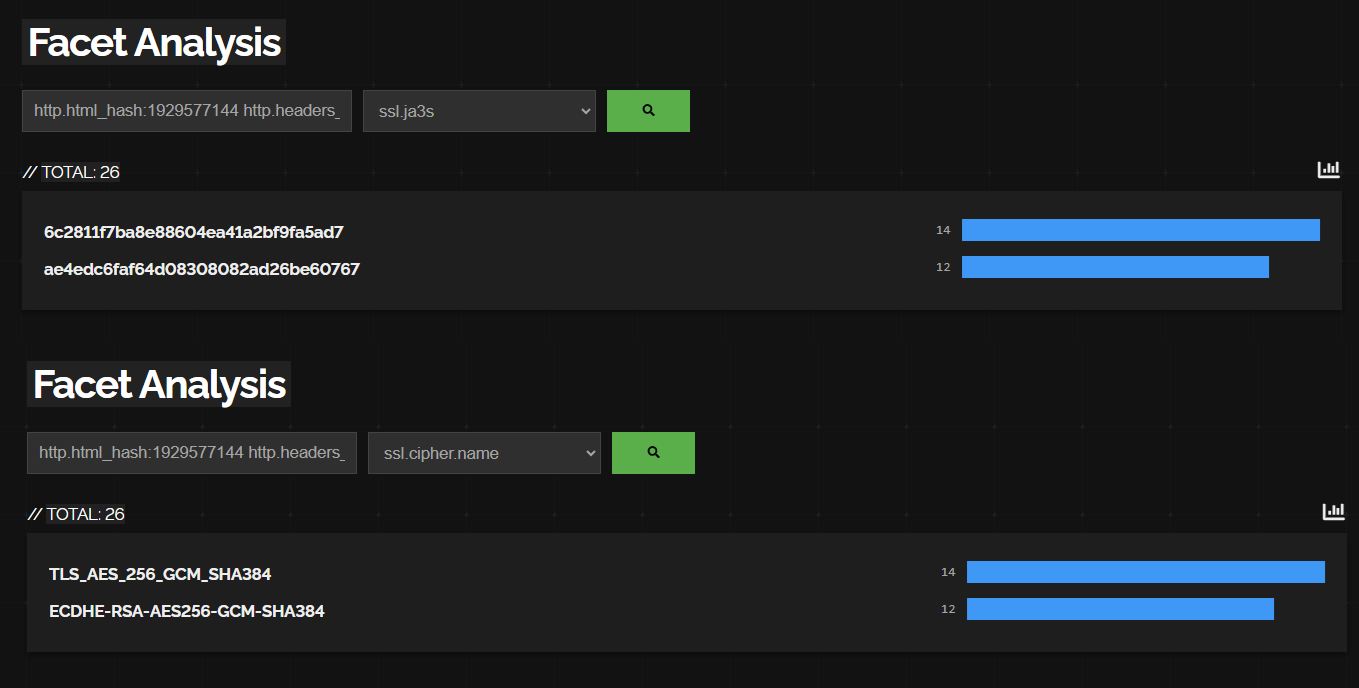
This also very nicely demonstrates how the JA3S value changes due to the cipher suite in the TLS connection, as the cipher is one of the building blocks the JA3S is calculated from.
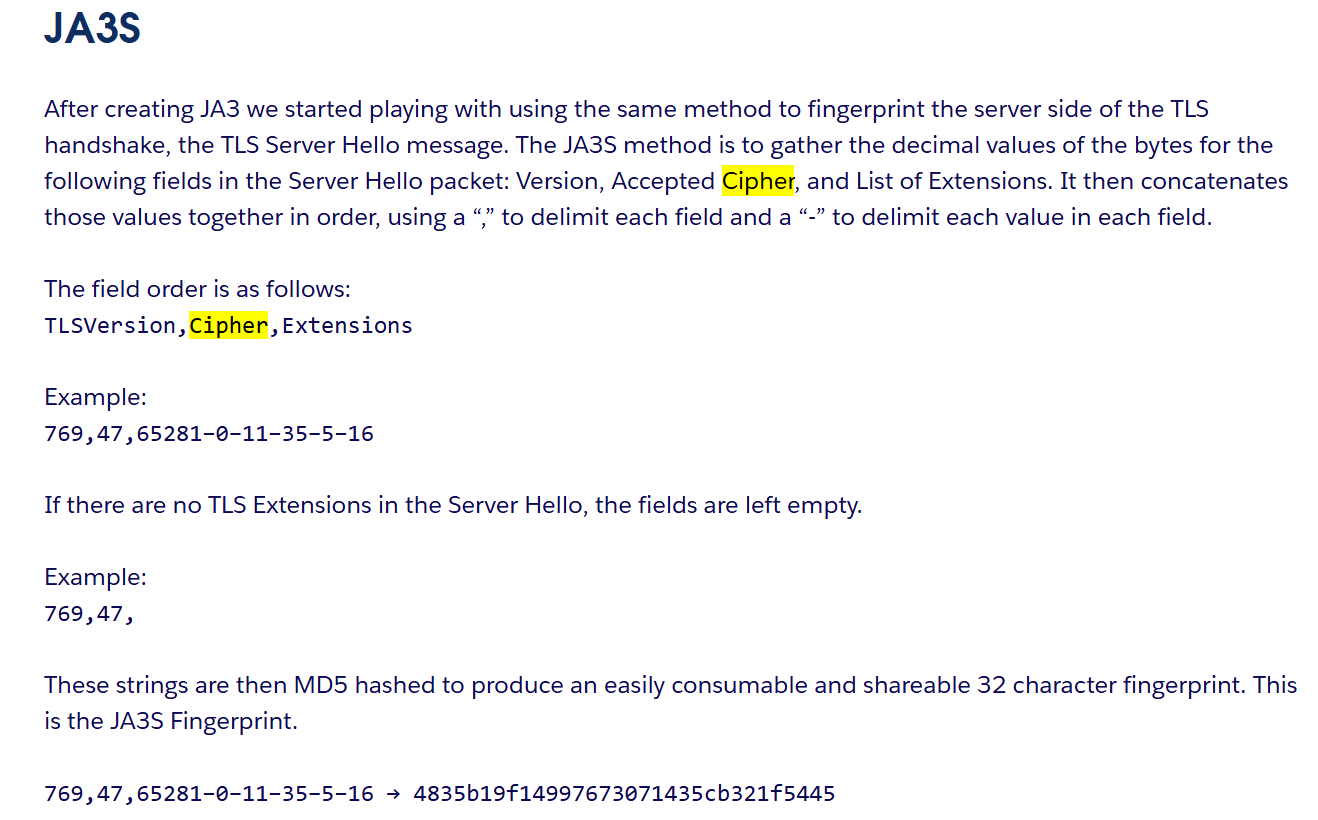
It is also possible to see the same phenomenon with the JARM values. As the first 30 digits of the value is:
“made of the cipher and TLS version chosen by the server for each of the 10 client hello’s sent. A “000” denotes that the server refused to negotiate with that client hello.”
Easily Identify Malicious Servers on the Internet with JARM
This means that 10 TLS Client Hello packets are sent to the server, and the specific attributes from the server’s responses are hashed and represented by three digits, resulting in the first 30 digits of the JARM value.
As we identified earlier 12 of the hosts use ECDHE-RSA-AES256-GCM-SHA384 while the remaining 14 use TLS_AES_256_GCM_SHA384, this can actually be seen in the values. Focusing only on the first 30 digits, it is clear that the first JARM value differs significantly from the others. The remaining ones are very similar to one another. Especially when you take into account that 000 means the server refused the negotiation for some reason and most of the hosts having responded with 42d at least once, just at different times within the 10 packets they received. This means that the 14 hosts have quite similar TLS implementations, though not identical. This could mean they are using the same C2 only configured differently, slightly different versions of the same C2, running on different operating systems or with different libraries being used.
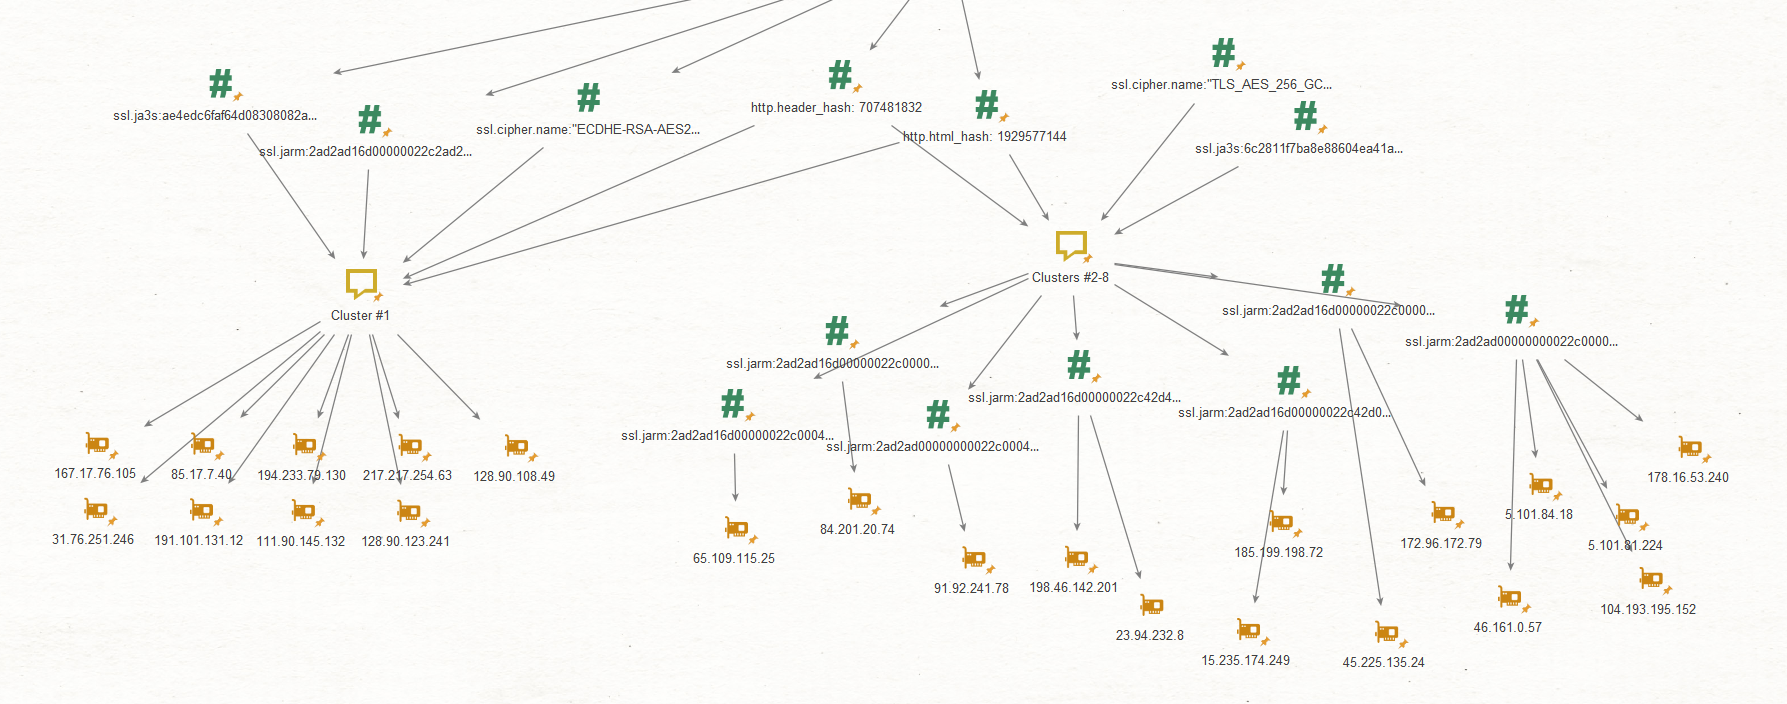
This information allows us to cluster these hosts based on their similarity and various aspects of their fingerprints. One clearly different cluster with all hosts having identical TLS implementations and another cluster/multiple smaller clusters of hosts with slightly different TLS implementations. By the time I built this graph the total number of hosts visible had gone down.
Conclusion
Although the two hosts identified from the article were no longer a part of live C2 infrastructure, pivoting from them through infrastructure analysis revealed 26 additional hosts with active C2 servers. Most of the identified C2 IP addresses were clean as far as Virustotal was concerned, some had multiple reports for different malware. Some of the Virustotal reports also confirm that our hypothesis that this was the same type of C2 that we began with (though here the PureHVNC C2 is using port 56001 here instead of 65001 from the article).
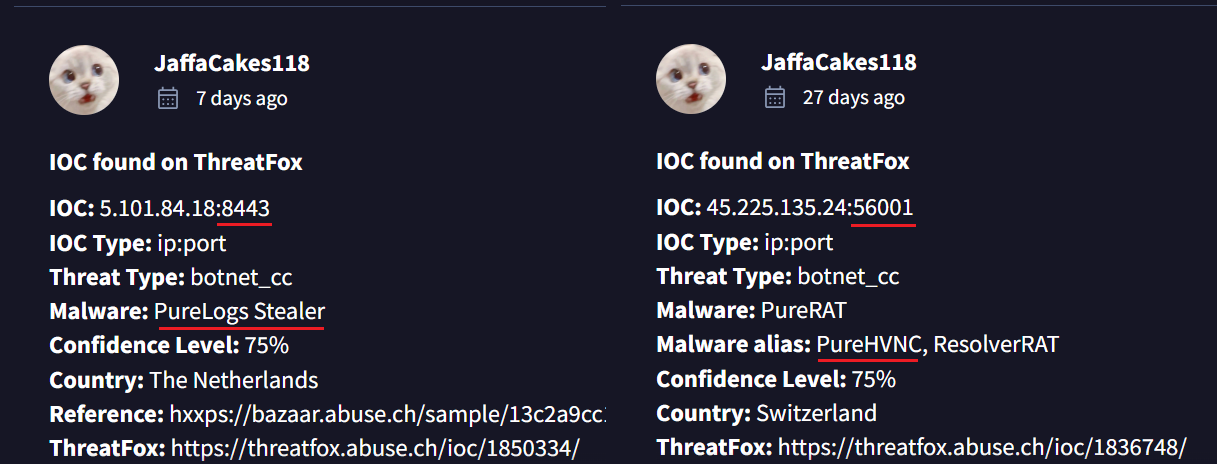
This shows some of the value of proactive infrastructure analysis, it is possible to map out additional C2s before they are identified as malicious or even used in attacks.
The analysis of the data also allowed the grouping of the 26 hosts into different clusters. We identified 12 hosts which are almost certainly set up identically and running the same software. This could be a sign of a campaign that is quite significant in size or it could be a bunch of lazy operators who have not changed the settings on their C2. The 14 remaining hosts were slightly different, some being unique and some in smaller clusters. This could represent a bunch of different campaigns set up by the same threat actor or just a bunch of different threat actors running the same software and having used or set them up differently.
Depending on the scope and context of the investigation and the initial point of entry, this type of information can be used to support attribution, improve understanding of a threat actor’s methods, comprehensively scope out a campaign or track a threat actor and identify the extent of their infrastructure.
1
2
3
4
5
6
7
8
9
10
11
12
13
14
15
16
17
18
19
20
21
22
23
24
25
26
27
28
29
30
31
32
33
34
35
36
37
38

Broad search query

http.html_hash:1929577144 http.headers_hash:707481832

Cluster #1

http.html_hash:1929577144 http.headers_hash:707481832 ssl.jarm:2ad2ad16d00000022c2ad2ad2ad2ad46ff59a659b30fd8aeaa6755c67691b4 ssl.ja3s:ae4edc6faf64d08308082ad26be60767

Cluster #2-8

http.html_hash:1929577144 http.headers_hash:707481832 ssl.ja3s:6c2811f7ba8e88604ea41a2bf9fa5ad7

All hosts identified at the time of writing this

167.17.76[.]105
31.76.251[.]246
172.96.172[.]79
5.101.84[.]18
185.199.198[.]72
91.92.241[.]78
85.17.7[.]40
45.225.135[.]24
84.201.20[.]74
46.161.0[.]57
198.46.142[.]201
5.101.81[.]224
191.101.131[.]12
194.233.79[.]130
111.90.145[.]132
65.109.115[.]25
217.217.254[.]63
15.235.174[.]249
128.90.123[.]241
128.90.108[.]49
178.16.53[.]240
23.94.232[.]8